This website is not current and will be retired at some point. See About for latest.
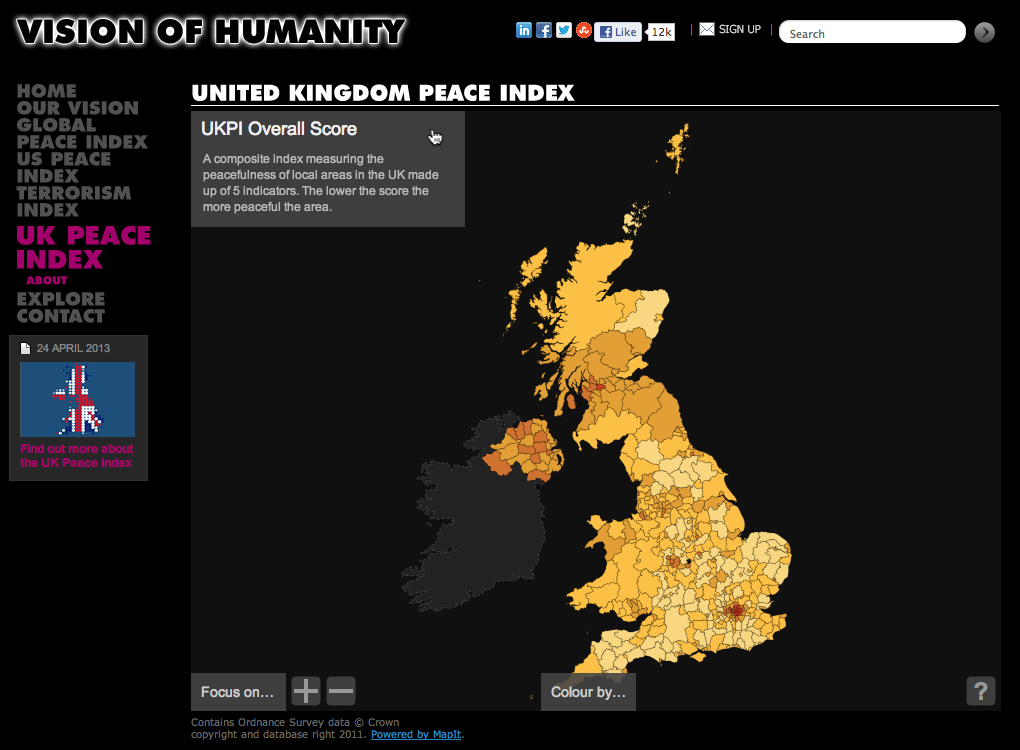
Developed with the Institute for Economics and Peace, this interactive map communicates the results of the United Kingdom Peace Index, a new measurement of the impact of violence across England, Wales, Scotland, and Northern Ireland.
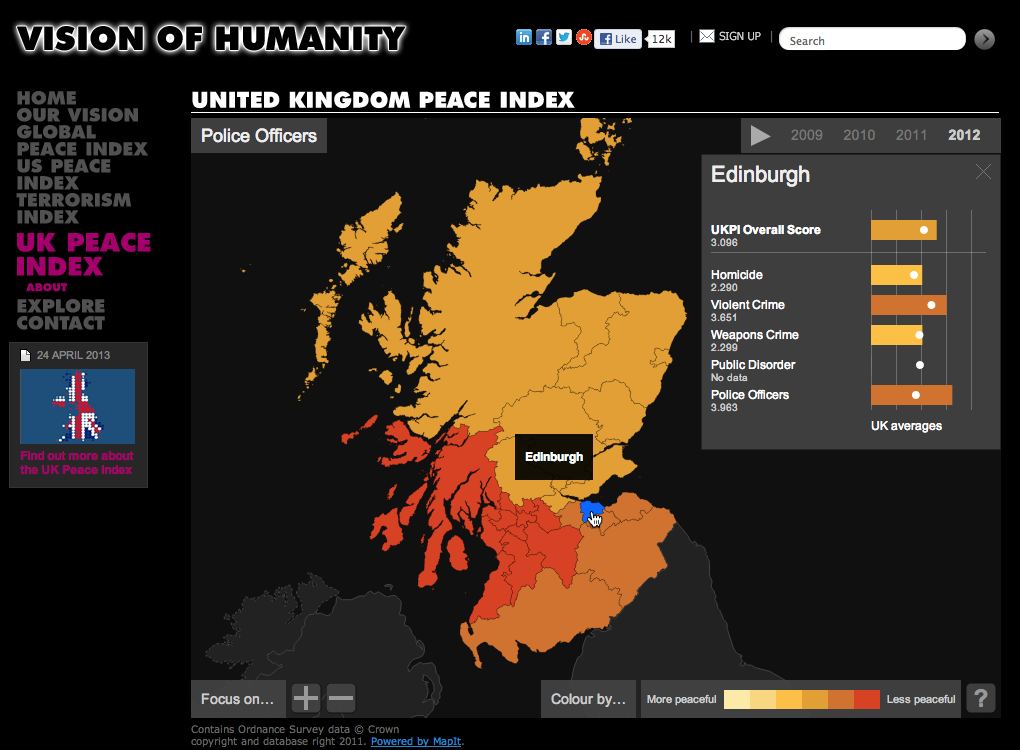
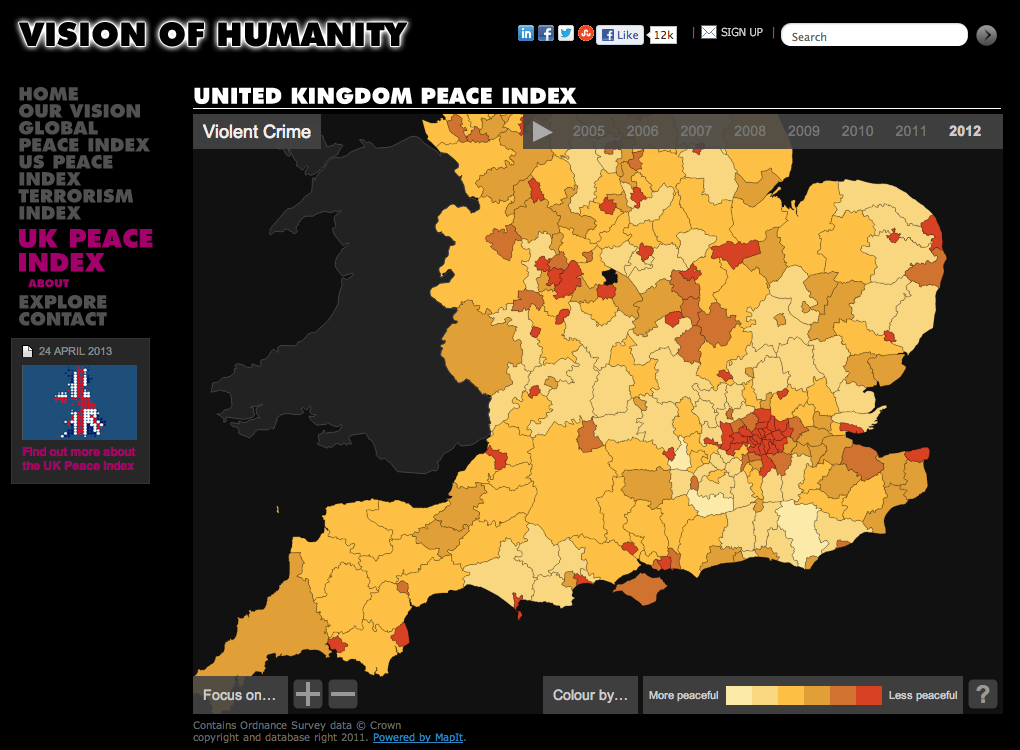
The map displays several years’ worth of historical data for four component indicators, plus one overall Peace Index value. A dynamic timeline allows play-through of the historical data on a per-country basis. By comparing local administrative areas while moving through time, it is possible to see how peace has increased or decreased over time.
Developed using D3 and TopoJSON, the map works on all current browsers that support SVG.
Thanks to Anna Powell-Smith for scripting help to extract geodata from MapIt, Michal Migurski for consultation on painlessly merging enormous GeoJSON files, and Tom MacWright, whose toGeoJSON tool enabled manual correction of unexpected boundary shapes.