This website is not current and will be retired at some point. See About for latest.
In a collaboration with Geoff McGhee of The Bill Lane Center for the American West and reporter Kate Galbraith of The Texas Tribune, I developed this interactive data graphic to accompany Kate’s article “In Era of Drought, Texas Cities Boost Water Rates”.
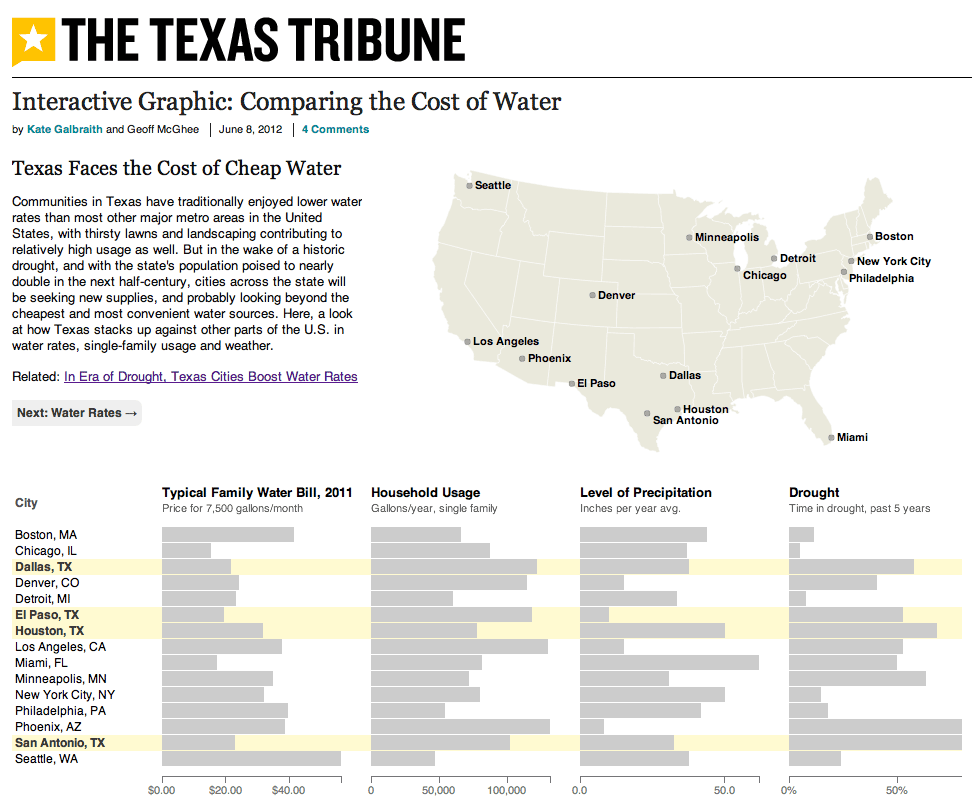
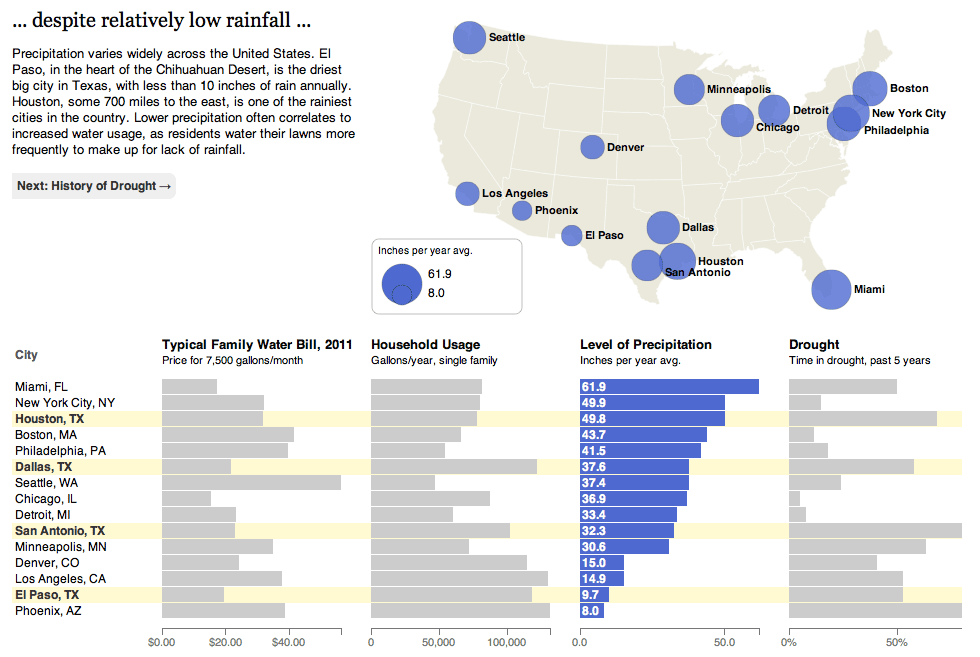
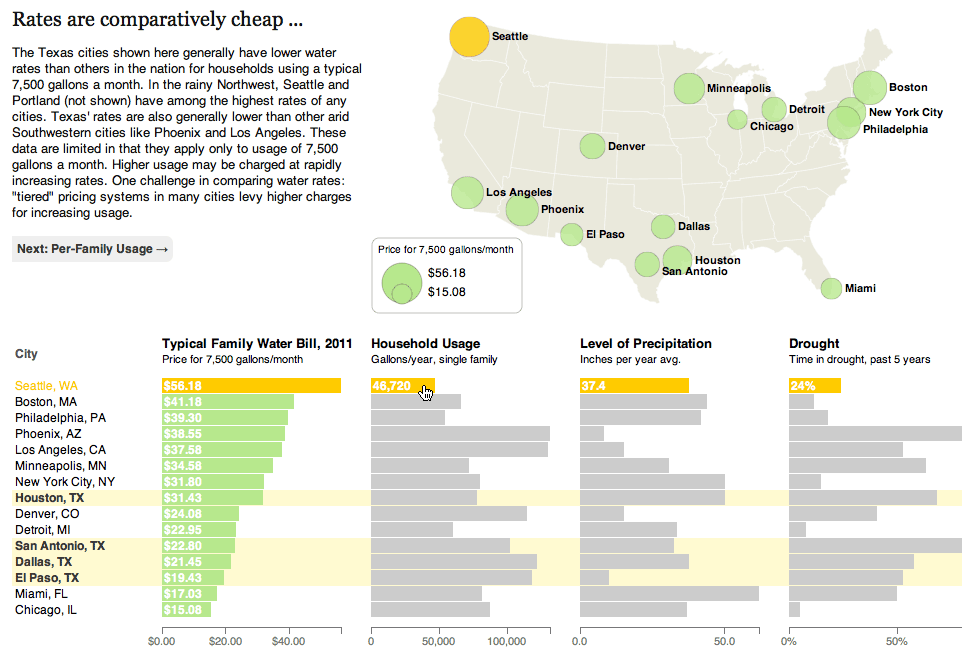
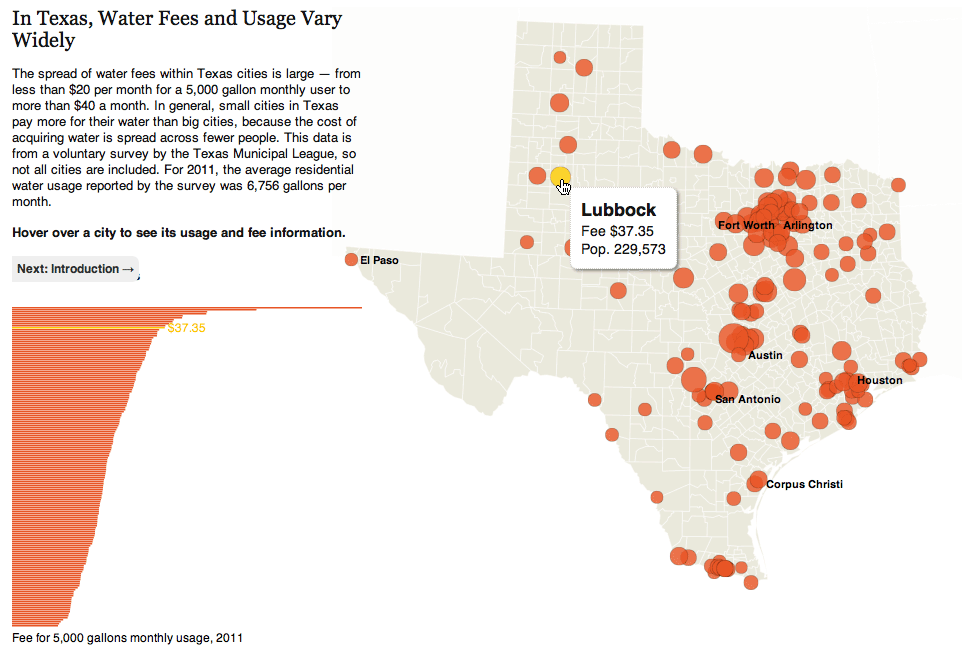
The story reports that, even in times of intense drought, customers in dry areas sometimes pay the least for water. Conversely, wet cities like Seattle may pay the most.
The map is organized around five brief stories, and enables comparison across geography and four scales (typical water bill, usage, precipitation, and drought).
Developed using D3.